| dc.contributor.author | Jiang, Shenghui | en_US |
| dc.contributor.author | Fang, Shiaofen | en_US |
| dc.contributor.author | Grannis, Shaun | en_US |
| dc.contributor.editor | Enrico Bertini and Niklas Elmqvist and Thomas Wischgoll | en_US |
| dc.date.accessioned | 2016-06-09T09:42:28Z | |
| dc.date.available | 2016-06-09T09:42:28Z | |
| dc.date.issued | 2016 | en_US |
| dc.identifier.isbn | 978-3-03868-014-7 | en_US |
| dc.identifier.issn | - | en_US |
| dc.identifier.uri | http://dx.doi.org/10.2312/eurovisshort.20161170 | en_US |
| dc.identifier.uri | https://diglib.eg.org:443/handle/10 | |
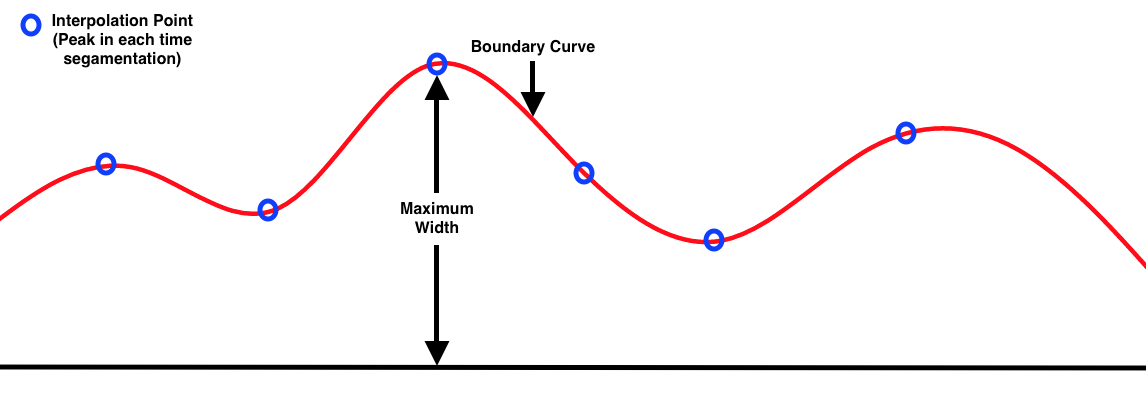
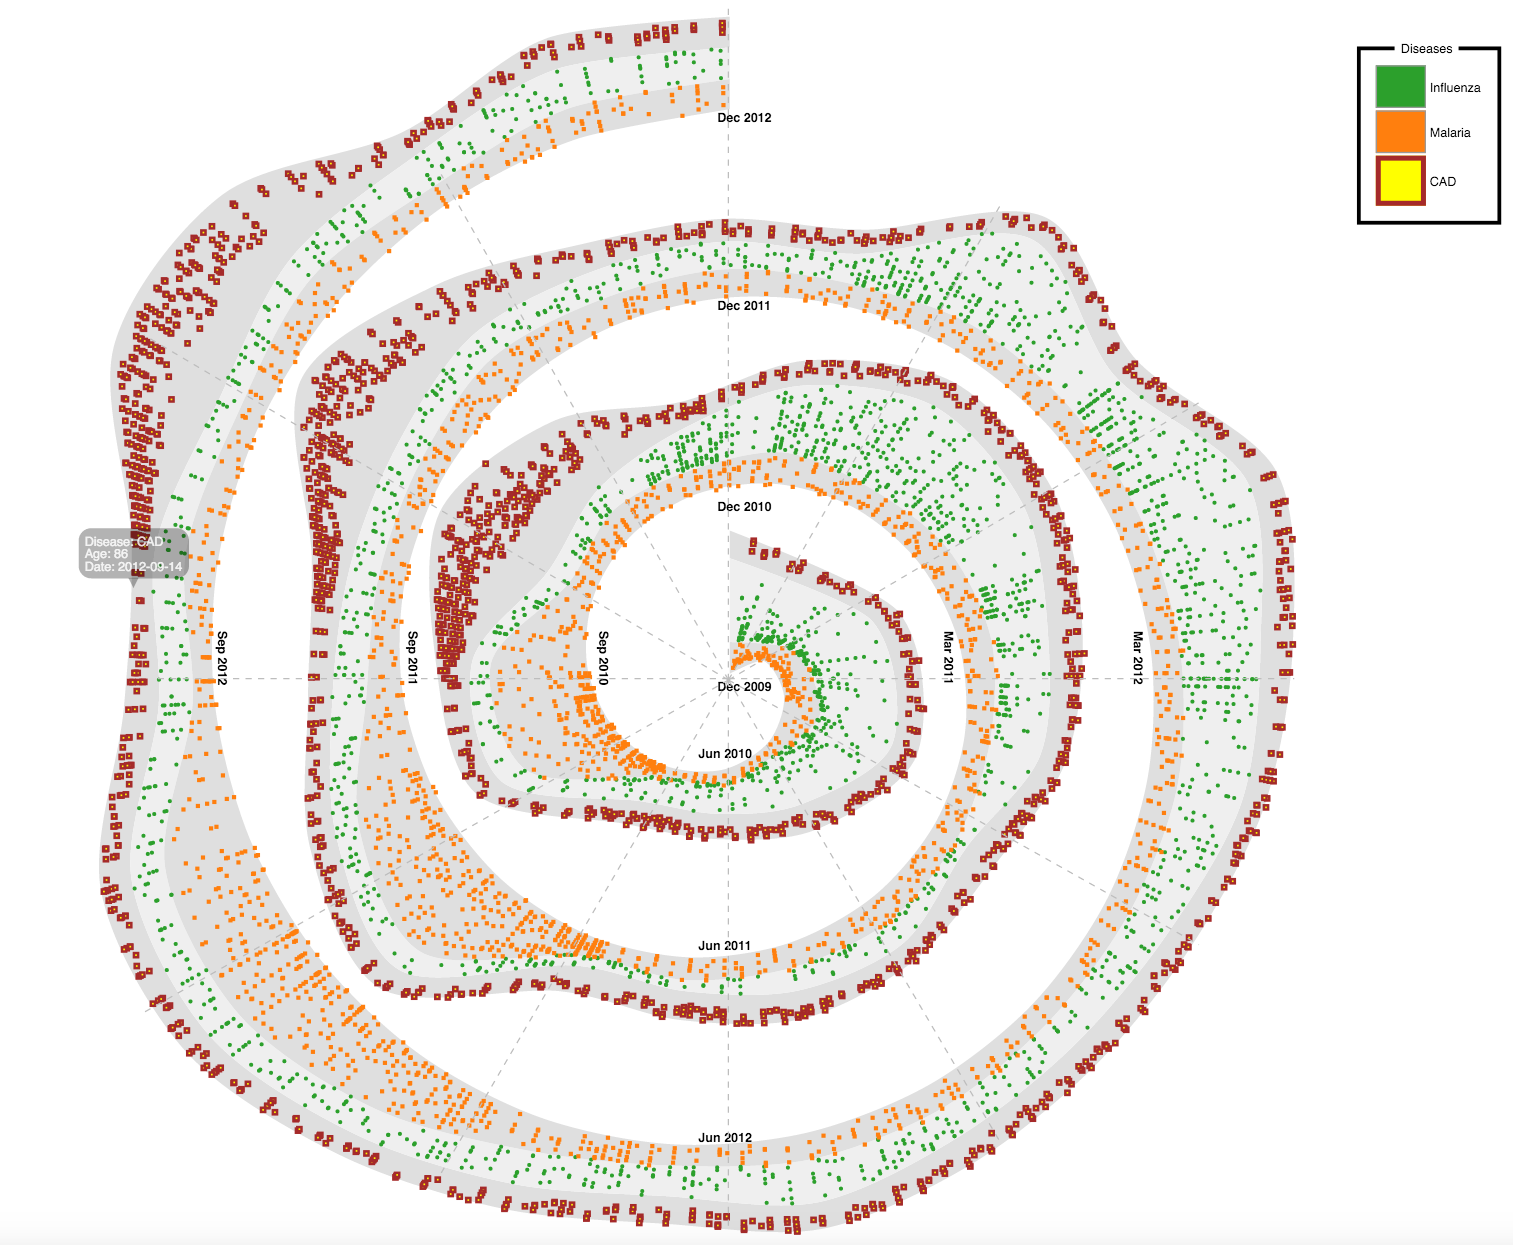
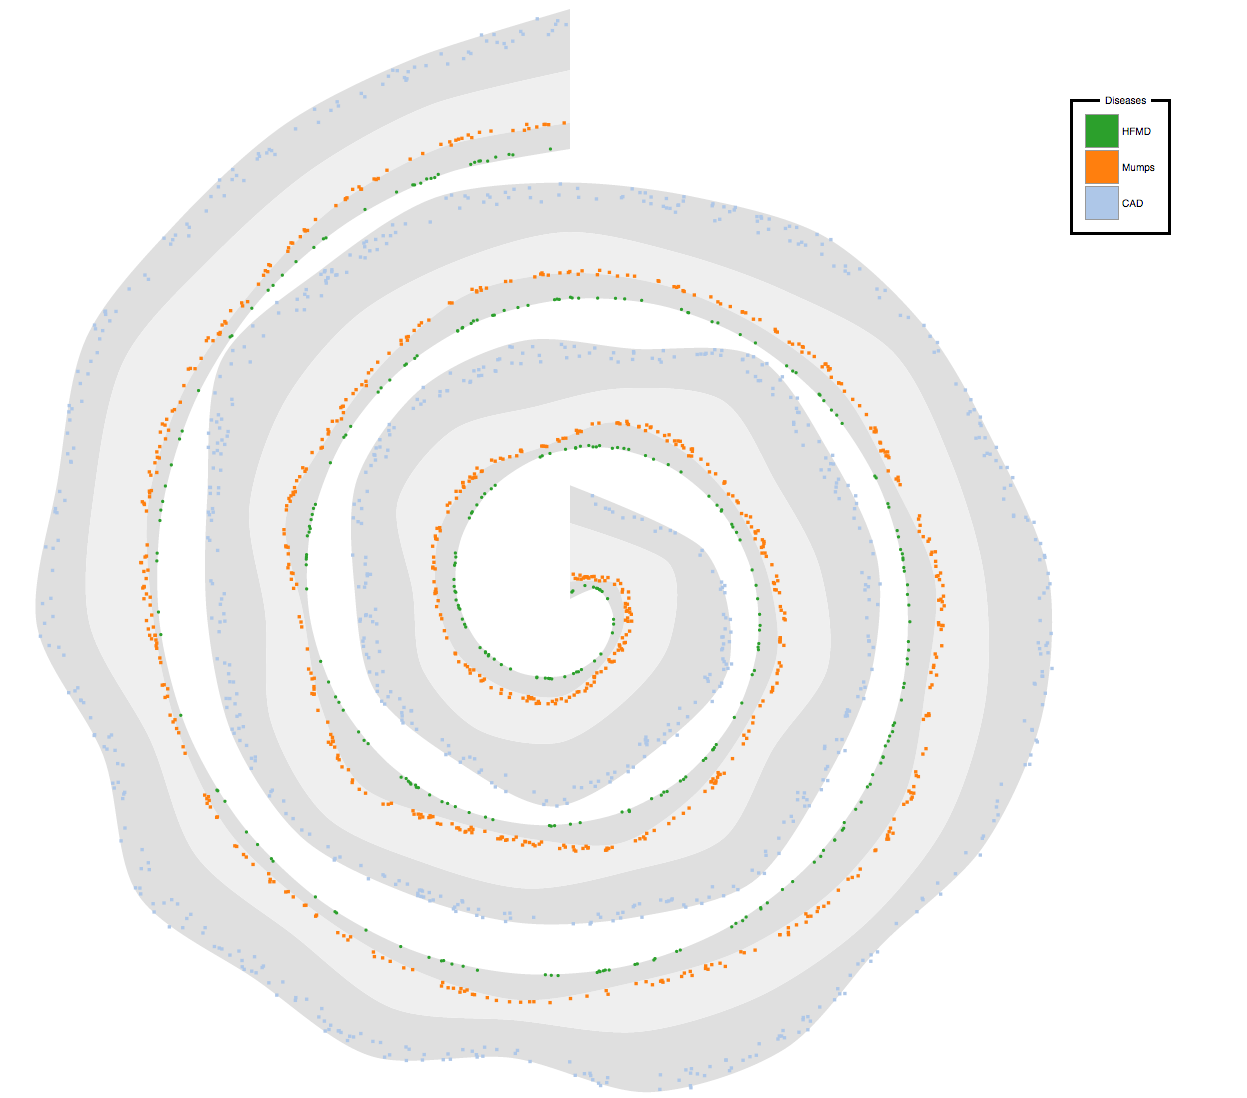
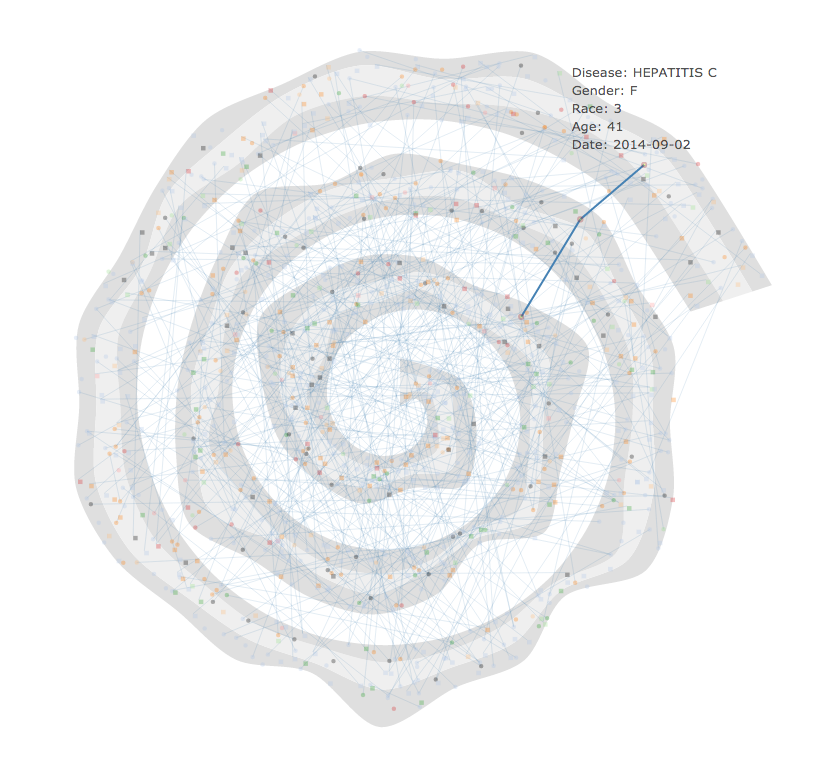
| dc.description.abstract | We introduce a new visualization method for temporal data, Spiral Theme Plot, by combining ThemeRiver method, spiral patterns, and scatter plot technique. Similar to ThemeRiver, data in different categories (themes) are visualized in different bands, but also in a spiral pattern. Themes are stacked along a spiral curve, which represent the time axis. Individual data points are plotted within the regions of the themes, with various visual features. In addition to showing the overall theme patterns over time, this approach also shows plotting patterns within the themes. Compared to ThemeRiver, Spiral Theme Plot can accommodate longer time axis, and more importantly, can provide periodic patterns that are typically not available in ThemeRiver. | en_US |
| dc.publisher | The Eurographics Association | en_US |
| dc.subject | Keywords | en_US |
| dc.subject | Temporal data visualization | en_US |
| dc.subject | Theme River | en_US |
| dc.subject | Scatter plot. | en_US |
| dc.subject | I.3.3 [Computer Graphics] | en_US |
| dc.subject | Picture/Image Generation | en_US |
| dc.subject | Line and curve generation | en_US |
| dc.title | Spiral Theme Plot | en_US |
| dc.description.seriesinformation | EuroVis 2016 - Short Papers | en_US |
| dc.description.sectionheaders | Design, Evaluation, and Applications | en_US |
| dc.identifier.doi | 10.2312/eurovisshort.20161170 | en_US |
| dc.identifier.pages | 109-112 | en_US |