| dc.contributor.author | Bögl, Markus | en_US |
| dc.contributor.author | Aigner, Wolfgang | en_US |
| dc.contributor.author | Filzmoser, Peter | en_US |
| dc.contributor.author | Gschwandtner, Theresia | en_US |
| dc.contributor.author | Lammarsch, Tim | en_US |
| dc.contributor.author | Miksch, Silvia | en_US |
| dc.contributor.author | Rind, Alexander | en_US |
| dc.contributor.editor | E. Bertini and J. C. Roberts | en_US |
| dc.date.accessioned | 2015-05-24T19:45:52Z | |
| dc.date.available | 2015-05-24T19:45:52Z | |
| dc.date.issued | 2015 | en_US |
| dc.identifier.uri | http://dx.doi.org/10.2312/eurova.20151107 | en_US |
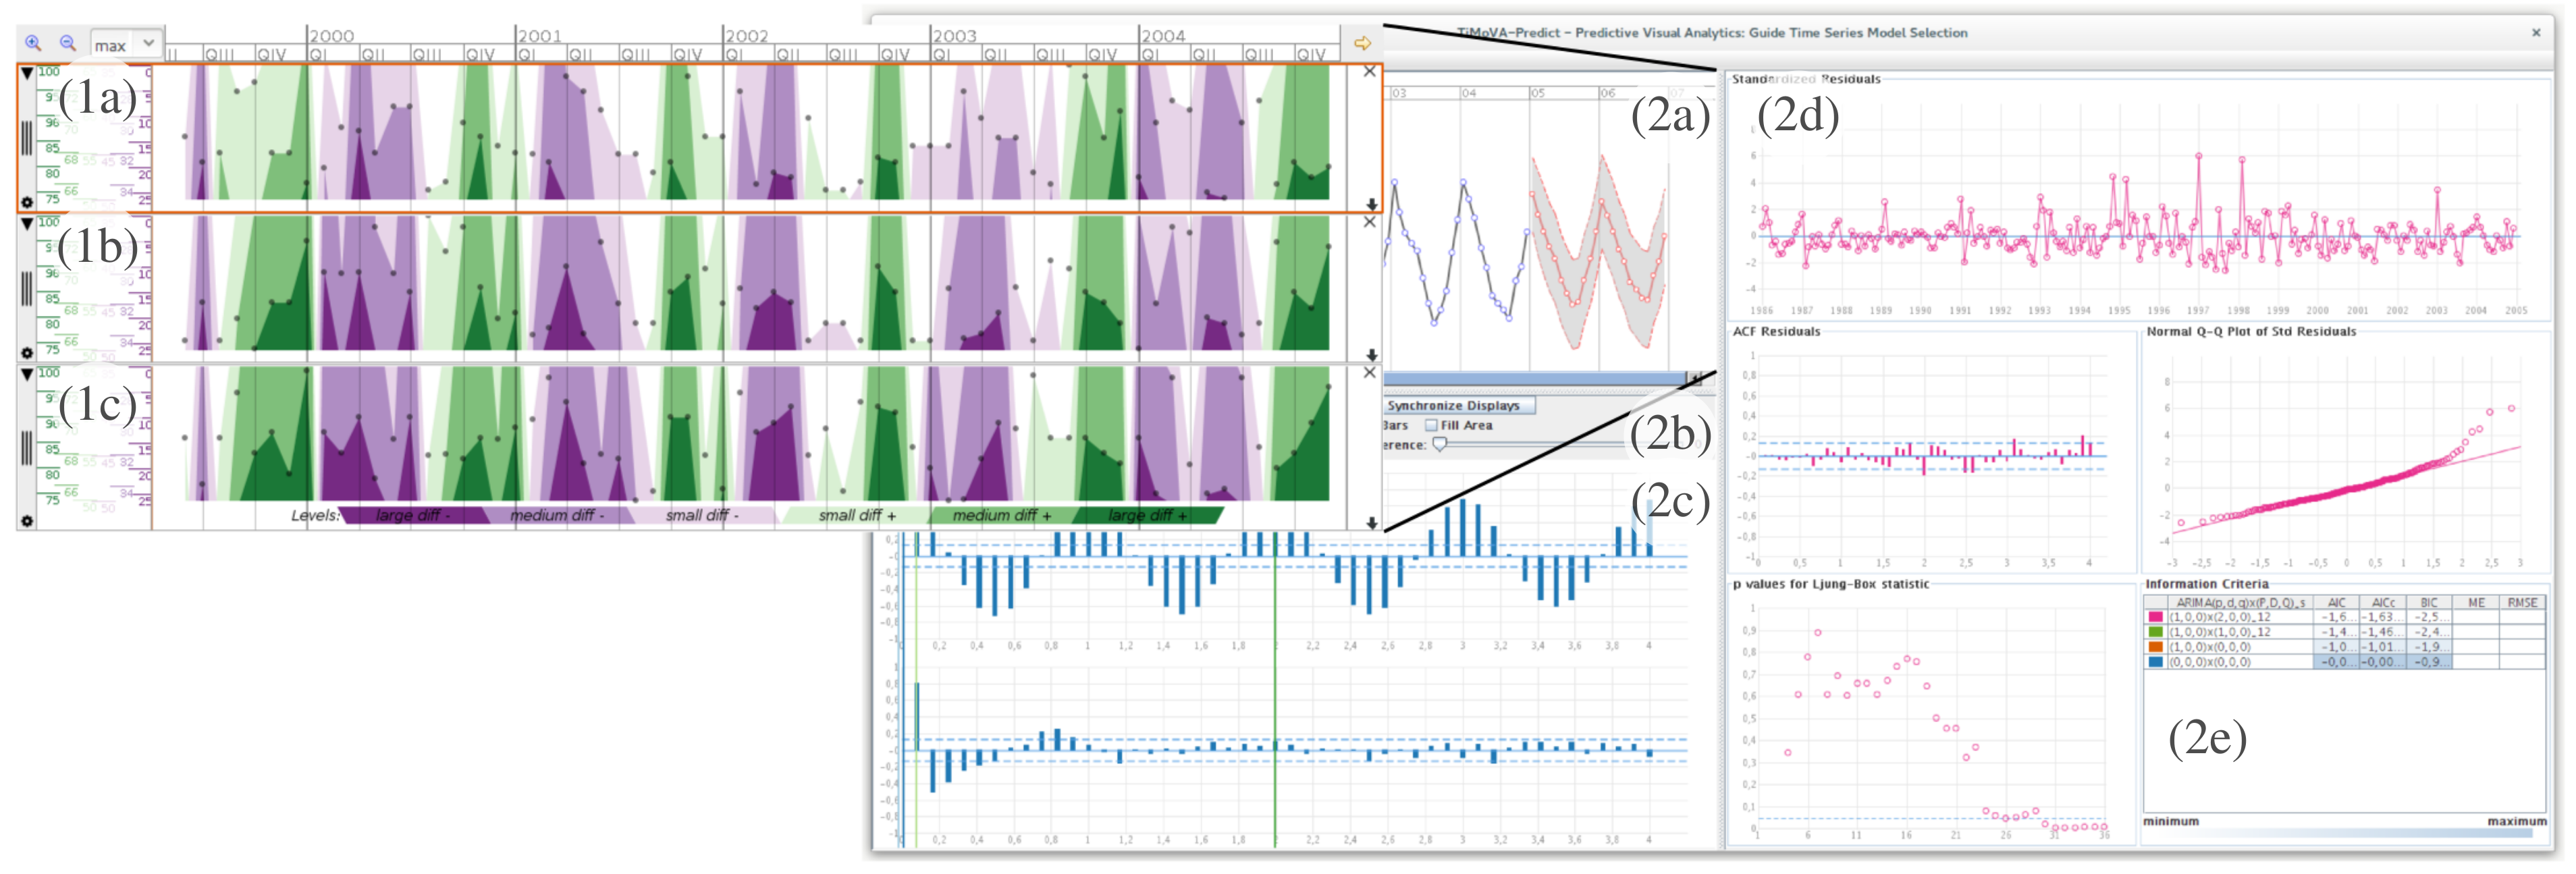
| dc.description.abstract | Time series appear in many different domains. The main goal in time series analysis is to find a model for given time series. The selection of time series models is done iteratively based, usually, on information criteria and residual plots. These sources may show only small variations and, therefore, it is necessary to consider the prediction capabilities in the model selection process. When applying the model and including the prediction in an interactive visual interface it is still difficult to compare deviations from actual values or benchmark models. Judging which model fits the time series adequately is not well supported in current methods. We propose to combine visual and analytical methods to integrate the prediction capabilities in the model selection process and assist in the decision for an adequate and parsimonious model. In our approach a visual interactive interface is used to select and adjust time series models, utilize the prediction capabilities of models, and compare the prediction of multiple models in relation to the actual values. | en_US |
| dc.publisher | The Eurographics Association | en_US |
| dc.subject | G.3 [Mathematics of Computing] | en_US |
| dc.subject | Probability and Statistics | en_US |
| dc.subject | Time Series Analysis H.5.2 [Information Interfaces and Presentation] | en_US |
| dc.subject | User Interfaces | en_US |
| dc.subject | Graphical user interfaces | en_US |
| dc.title | Integrating Predictions in Time Series Model Selection | en_US |
| dc.description.seriesinformation | EuroVis Workshop on Visual Analytics (EuroVA) | en_US |
| dc.description.sectionheaders | Time-series and Temporal Data | en_US |
| dc.identifier.doi | 10.2312/eurova.20151107 | en_US |
| dc.identifier.pages | 73-77 | en_US |